 ClosersHQ
My HQ: a sales dashboard you build
Your headquarters. Built by you.
My HQ is the dashboard you put together yourself: the numbers, graphs, lists and tabs you want, in the order you want, on your phone and on a computer.
Get started free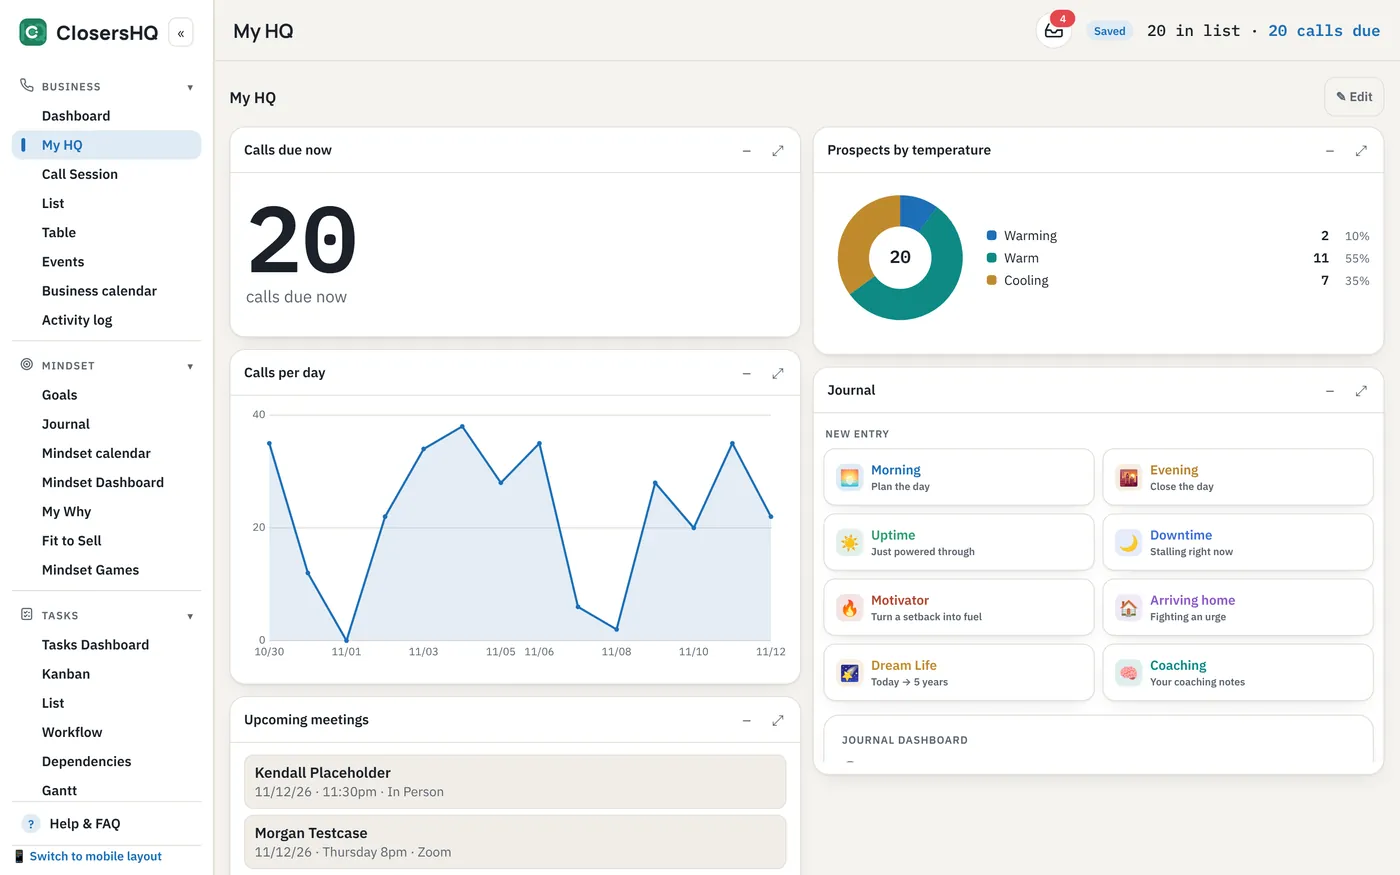
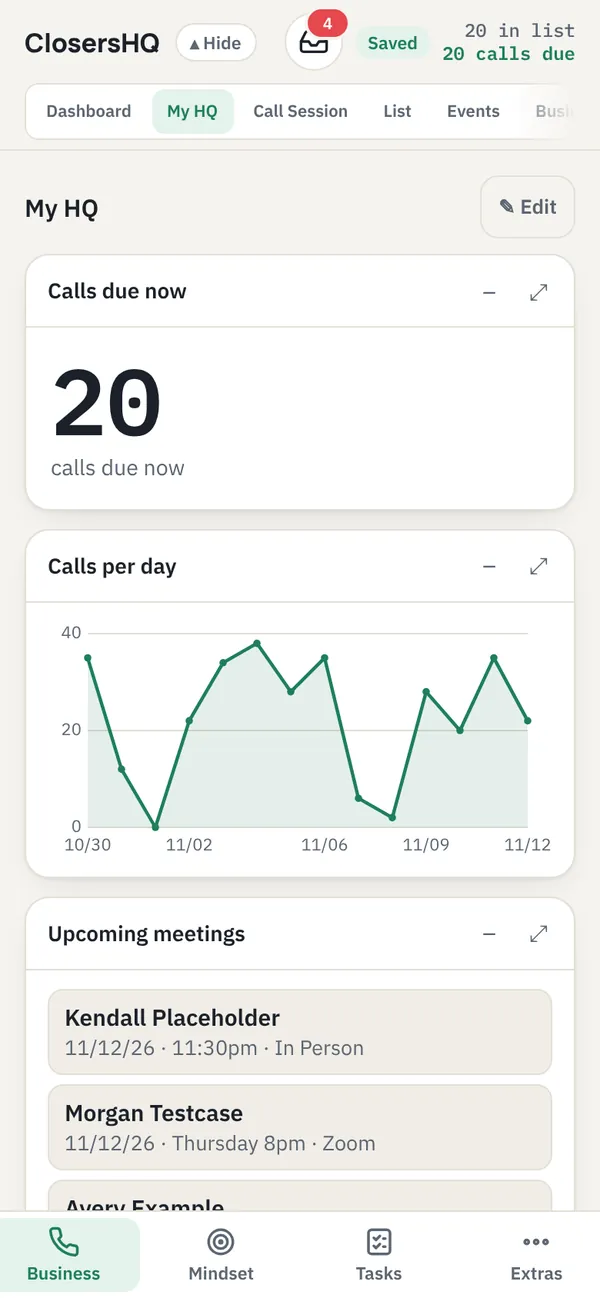
On your phone
Everything that matters, on one screen.
- Open the app and your numbers are there: calls due now, calls per day, who is hot and who is cooling off.
- Mix business and mindset: put your goals or your journal beside your call numbers.
- Sections stack in one column on a phone and sit side by side when you turn it sideways.
Edit
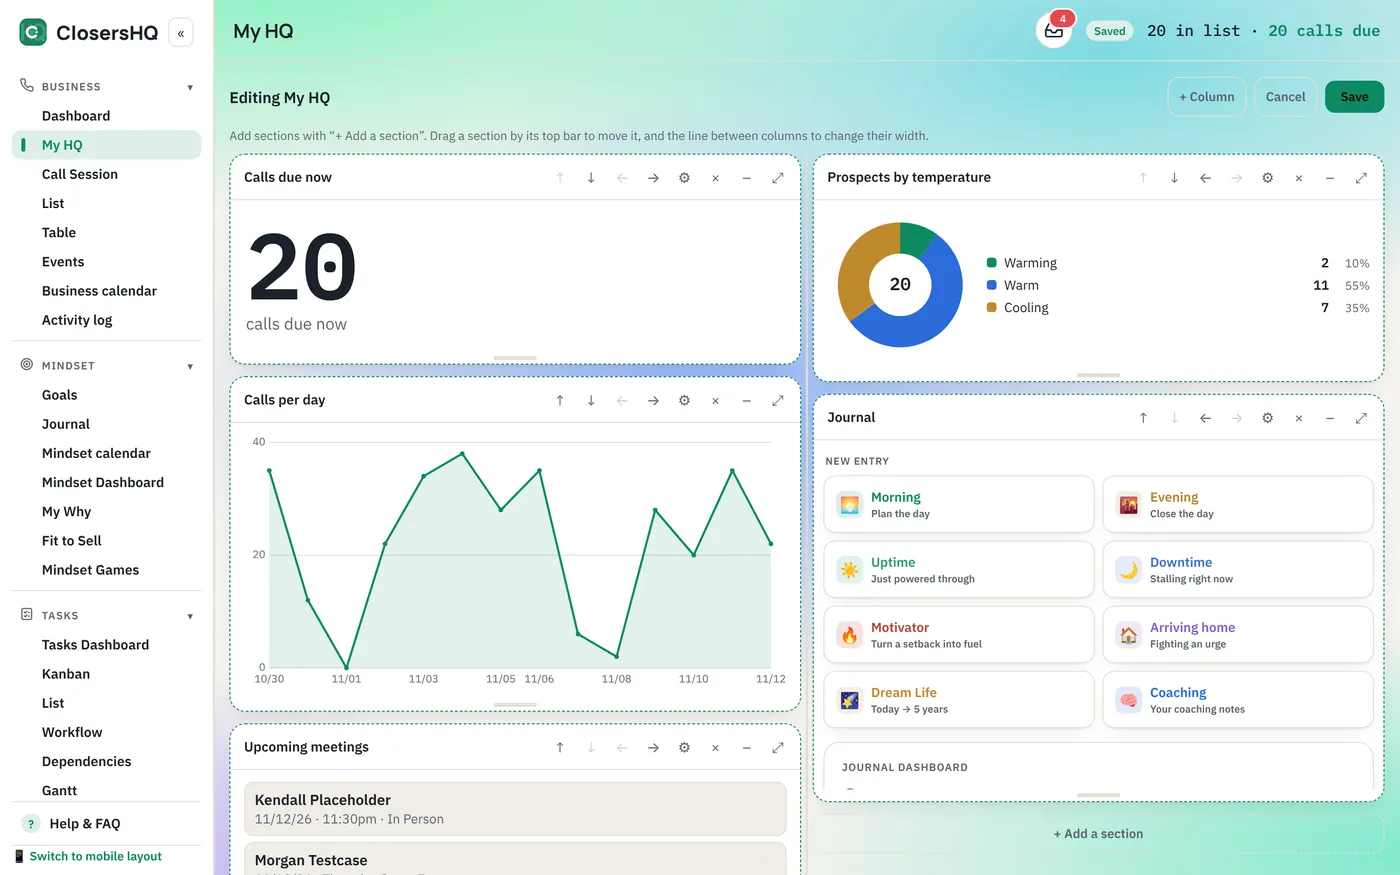
Drag sections where you want them.
Press Edit and every section gets a handle. Drag one by its top bar and the others close up behind it. Add up to five columns and drag the line between them to make one wider.
Create a section
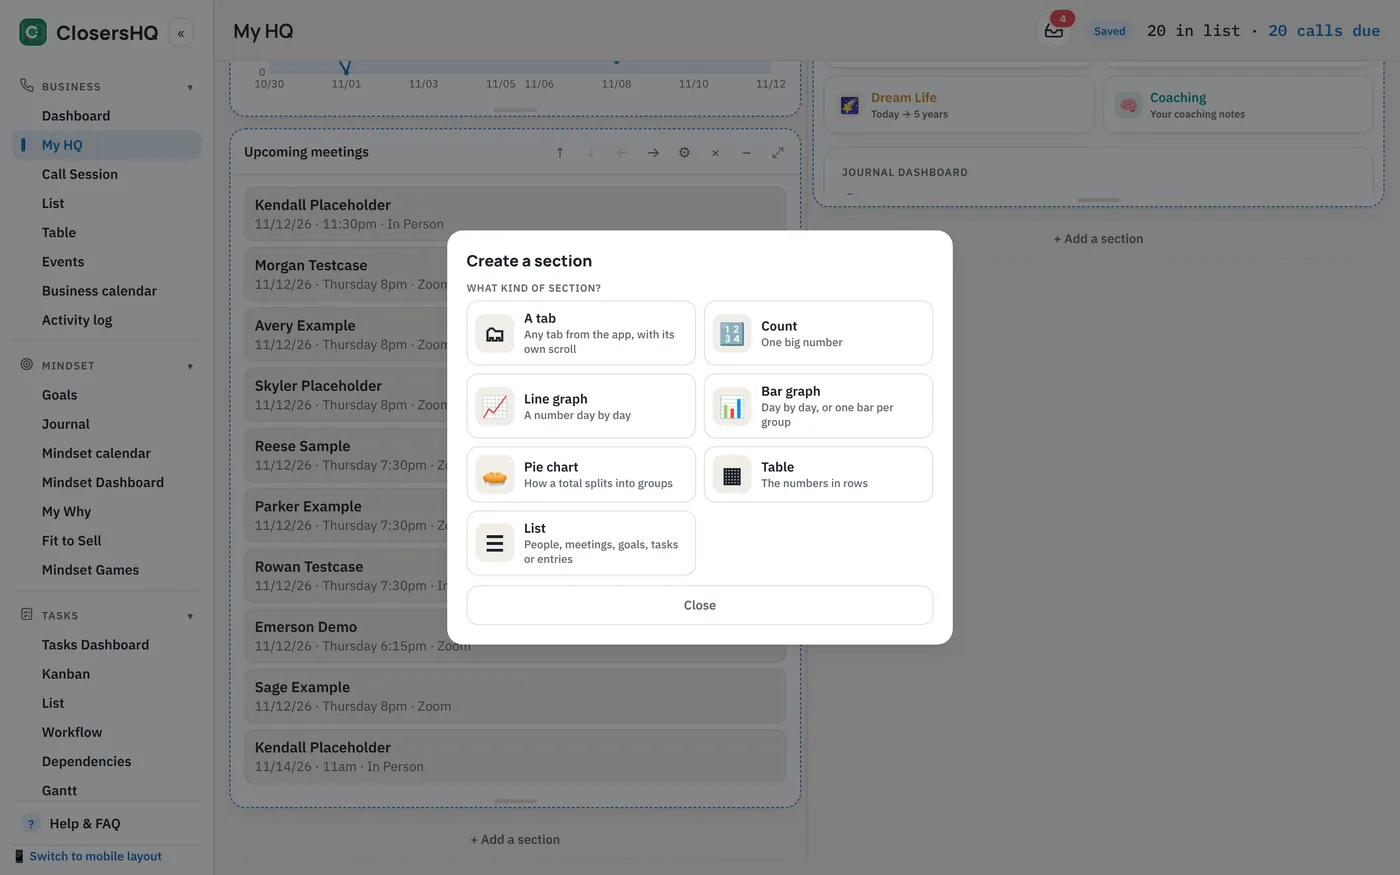
Seven kinds of section. You choose what each one shows.
A count, a line graph, a bar graph, a pie chart, a table, a list, or a whole tab from the app with its own scroll. Then pick what it shows: calls per day, prospects by temperature, type or status, calls due now, upcoming meetings, your goals or your journal.
Expand
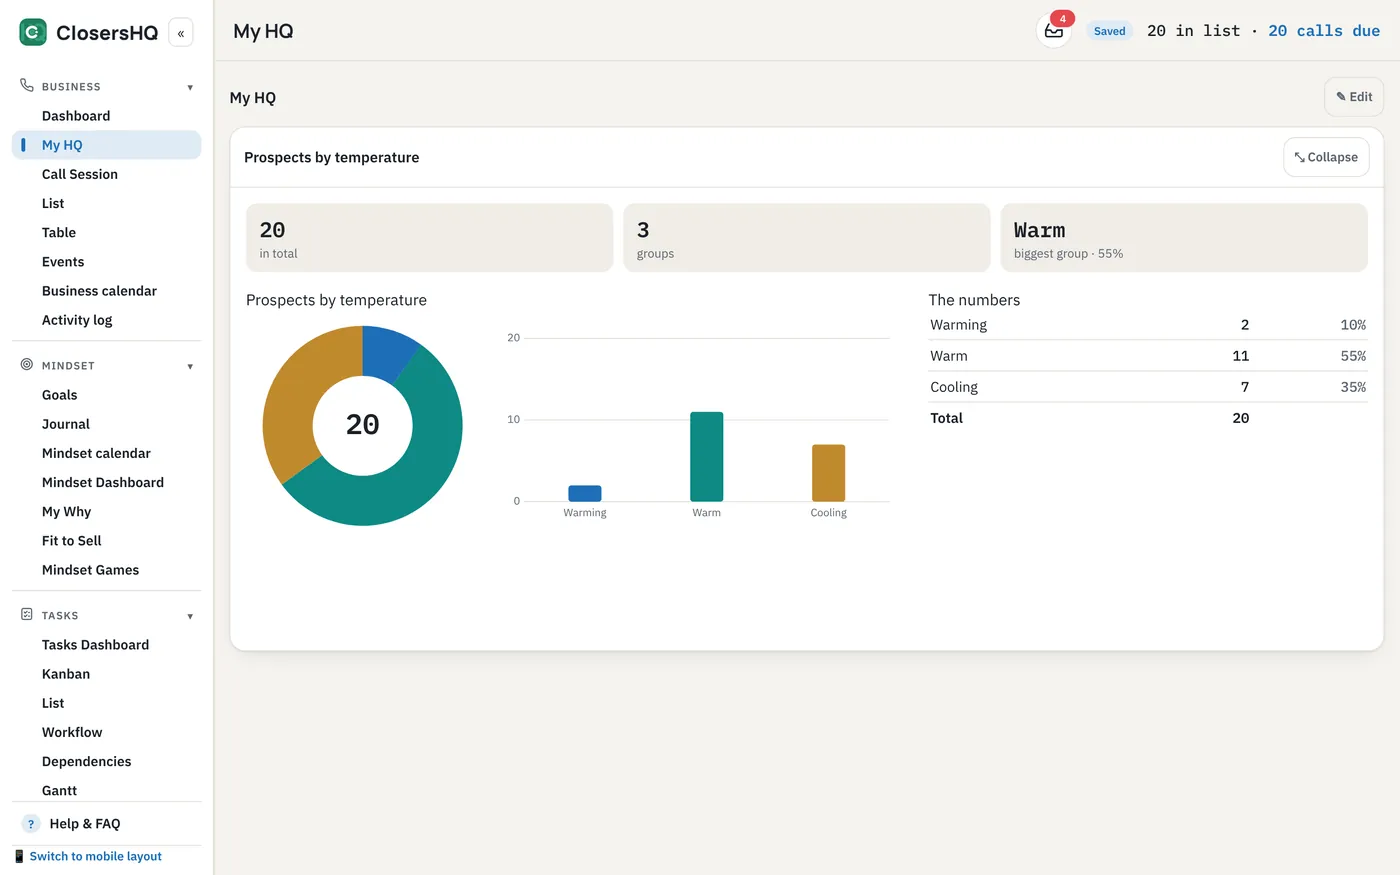
The detail is one click away.
Every section has an expand button. A graph adds totals, the average, your best day and a day-by-day table. A pie chart lists each group with its count and share. A count shows the people behind the number.
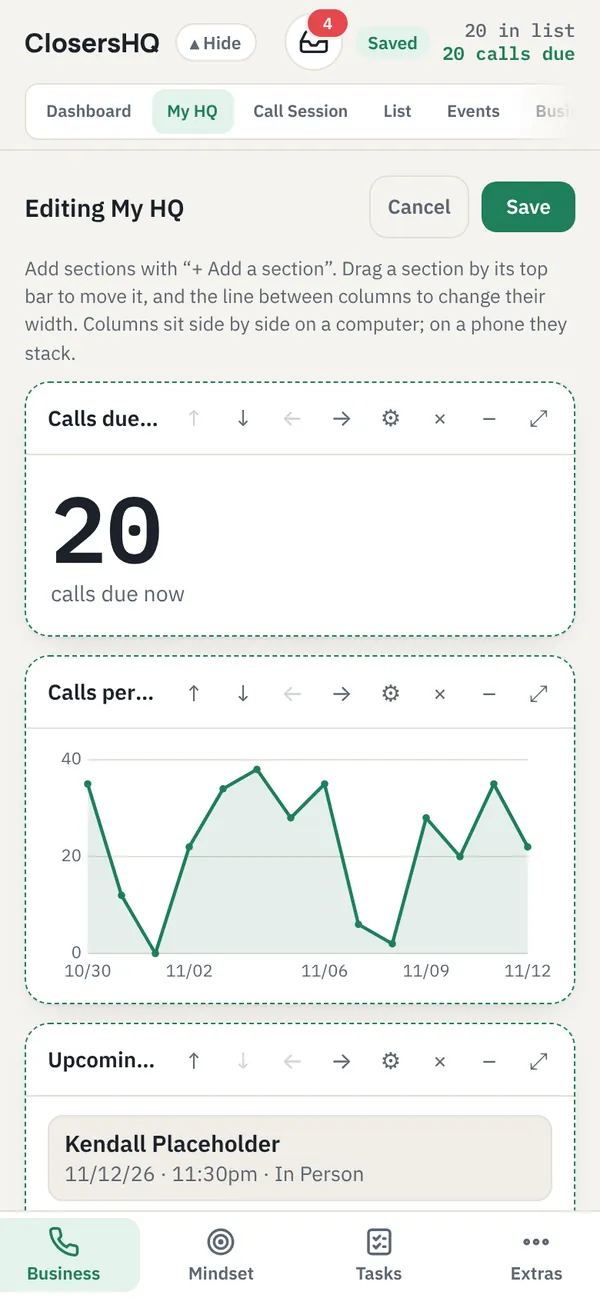
Editing on a phone
Build it with your thumb.
- Edit, then “+ Add a section” wherever you want one.
- Arrows move a section up or down; the cog changes what it shows; × removes it.
- Save over the view you’re on, or save it as a new one.
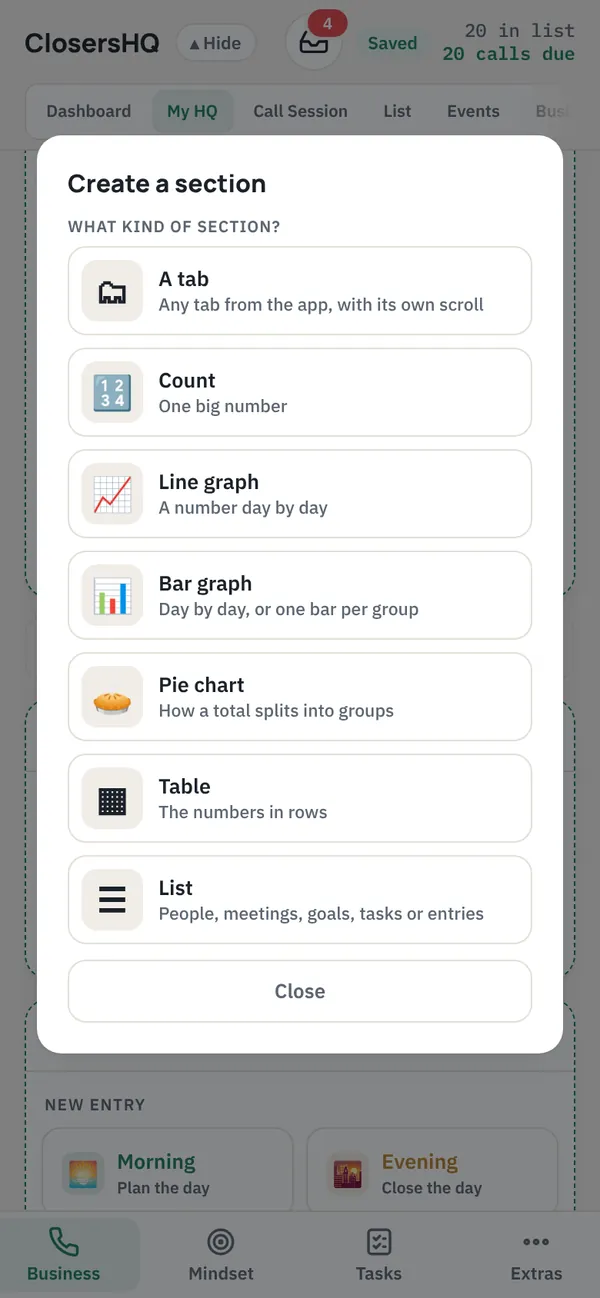
Create a section
Pick a kind, then what it shows.
- Choose how many days back a graph looks.
- Filter by the type of prospect where it applies.
- Add as many sections as you like. The page scrolls.
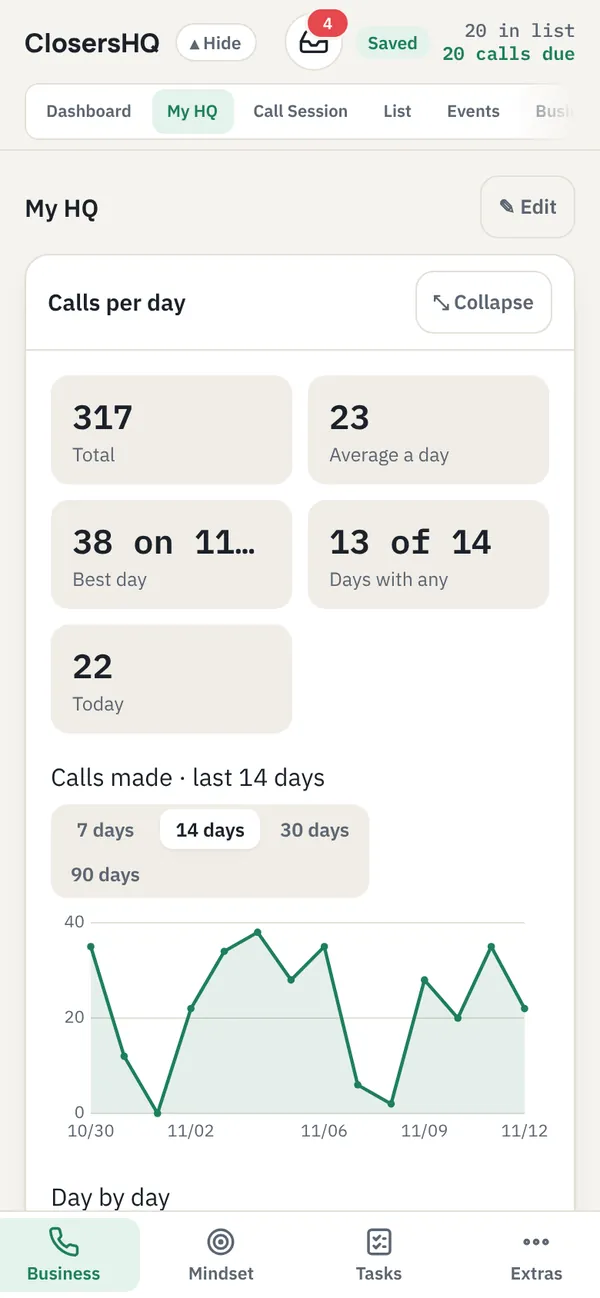
Resize and expand
A section shows more as it grows.
- Drag a section’s bottom edge to make it taller. On a phone, tap it first so it never resizes while you scroll.
- Small shows the basics. Taller adds the key numbers. Taller still shows everything.
- Tap – to fold a section down to its title, and expand for the full detail.
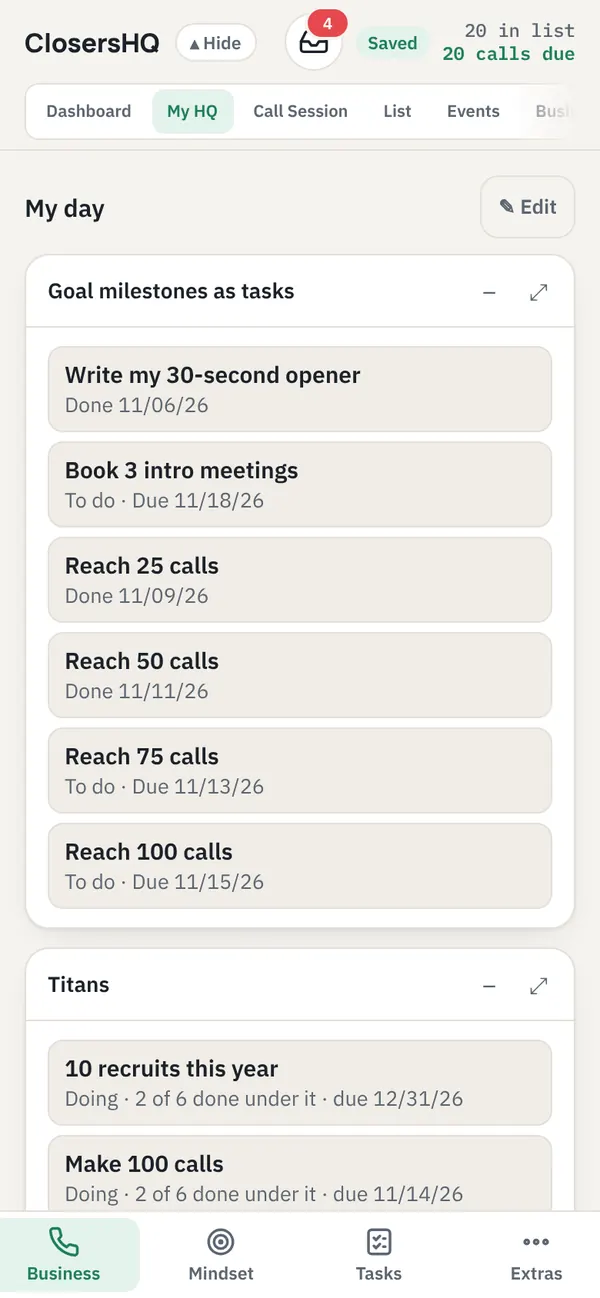
Tasks on My HQ
Your goals’ milestones, as things to do.
- A goal can make a task for each of its milestones. Put them on My HQ as a list.
- Add counts, graphs and lists of your tasks: open, overdue, due today, by status, done per day.
- A task isn’t counted up like a goal. It is To do, Doing, Waiting or Done.
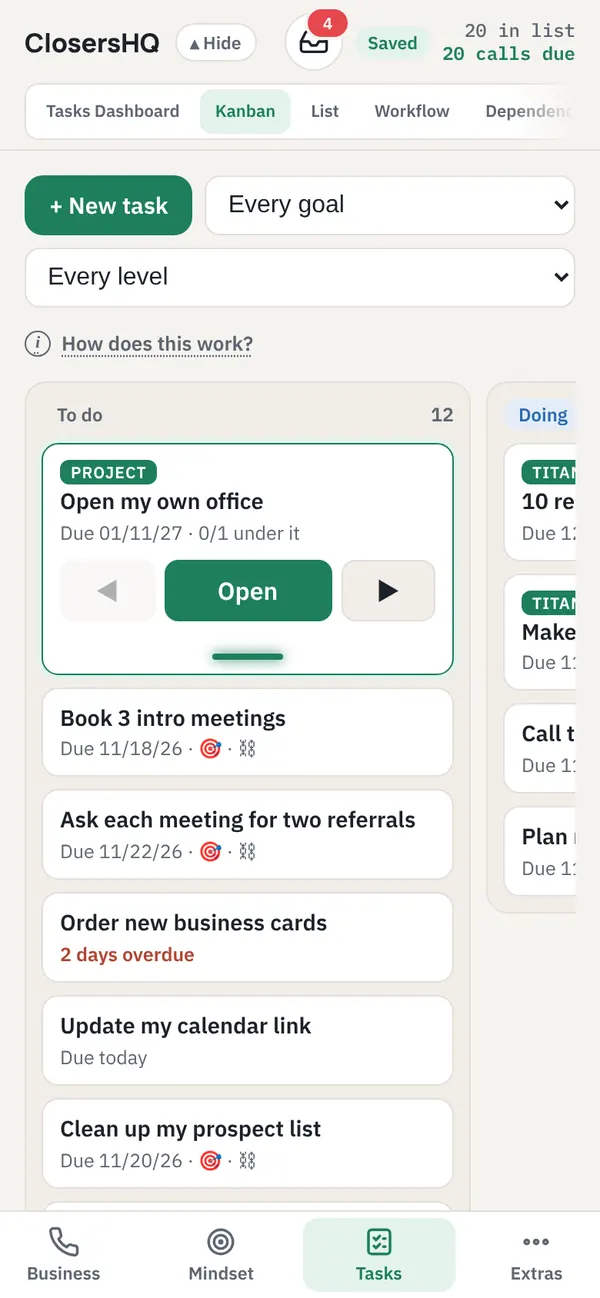
The Tasks tabs
A board you can drag, and four more ways to see it.
- Kanban: tap a task to select it, then drag it to another column.
- List by due date, a Workflow of numbered steps, and a Dependencies chart of what waits on what.
- Tasks have notes, photos, a start date and a due date. On a team, assign one to a teammate or add viewers.
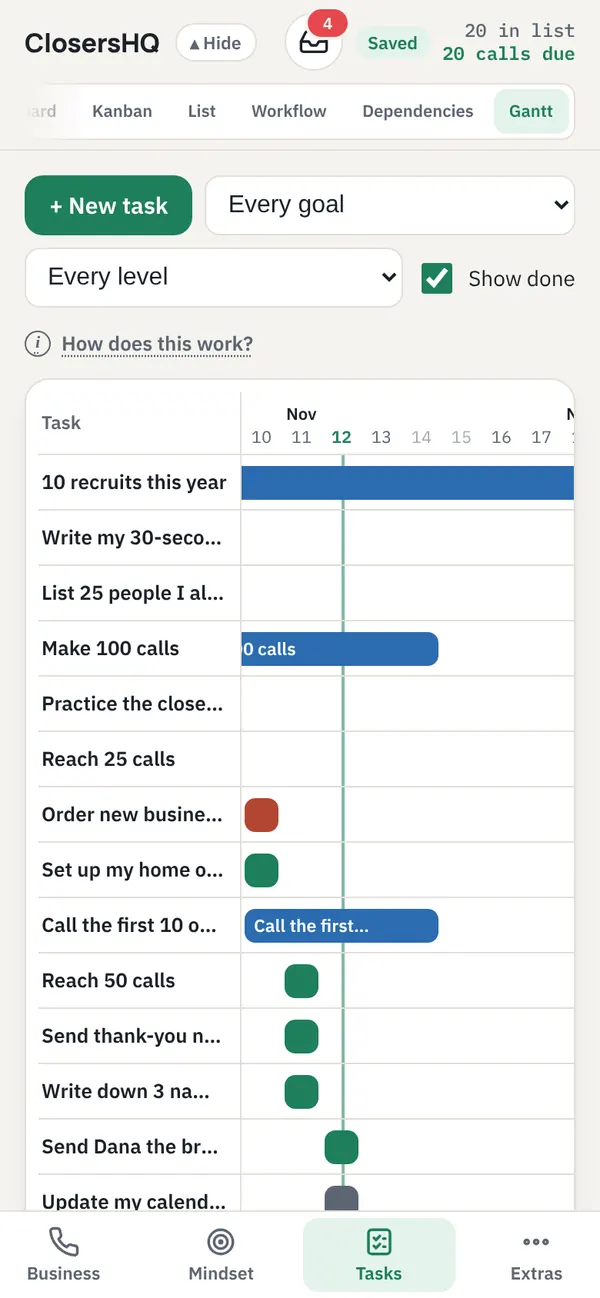
Gantt chart
See the whole plan on a timeline.
- A bar for each task from its start date to its due date.
- Colors show what is being worked on, waiting, done or overdue.
- Tap a bar to open the task.
More you can do
Yours to arrange, and it stays that way.
- Save different views, such as “Morning calls” and “Friday review”, and switch between them from a menu at the top.
- Your layout follows your account to every phone and computer you sign in on.
- The Business Dashboard and the Mindset Dashboard can be edited the same way.
- On a team, leaders can share a Team default as a starting point. Change it and your version is saved as your own view.
- Whatever theme you pick, light or dark, My HQ wears it.
- Nothing is locked in: change a section, remove it, or delete a view you no longer use.
Questions
What is My HQ?
My HQ is a dashboard you put together yourself in ClosersHQ. You choose the sections, what each one shows and where it sits, on your phone and on a computer.
What can I put on My HQ?
Seven kinds of section: a count, a line graph, a bar graph, a pie chart, a table, a list, or a whole tab from the app. Each one can show things such as calls per day, prospects by temperature, calls due now, upcoming meetings, goals, tasks or your journal.
Does my layout follow me to other devices?
Yes. Your layout is saved with your account, so it is the same on every phone and computer you sign in on.
Can I save more than one dashboard?
Yes. Save as many views as you like, such as one for mornings and one for a weekly review, and switch between them from a menu at the top.
Your next call is waiting.
Enter your email, get a code, and you’re in. New here or coming back, it’s the same button.
Sign in or get started